Where do I find historical intraday data for stocks?
2020-07-05 15:02 in Financial Market Data
While it is relatively easy these days to find historical end-of-day data for markets analysis and strategy purposes, this is not the case for historical intraday data. I tried a lot of data providers among others but i was never satisfied, because often: the data is not complete, the timings intervals were fixed (5mn, 15mn, etc), not all markets (no forex or crypto) are available, only the US markets… I kept my pain in patience until recently I made a phenomenal discovery by a tweet.
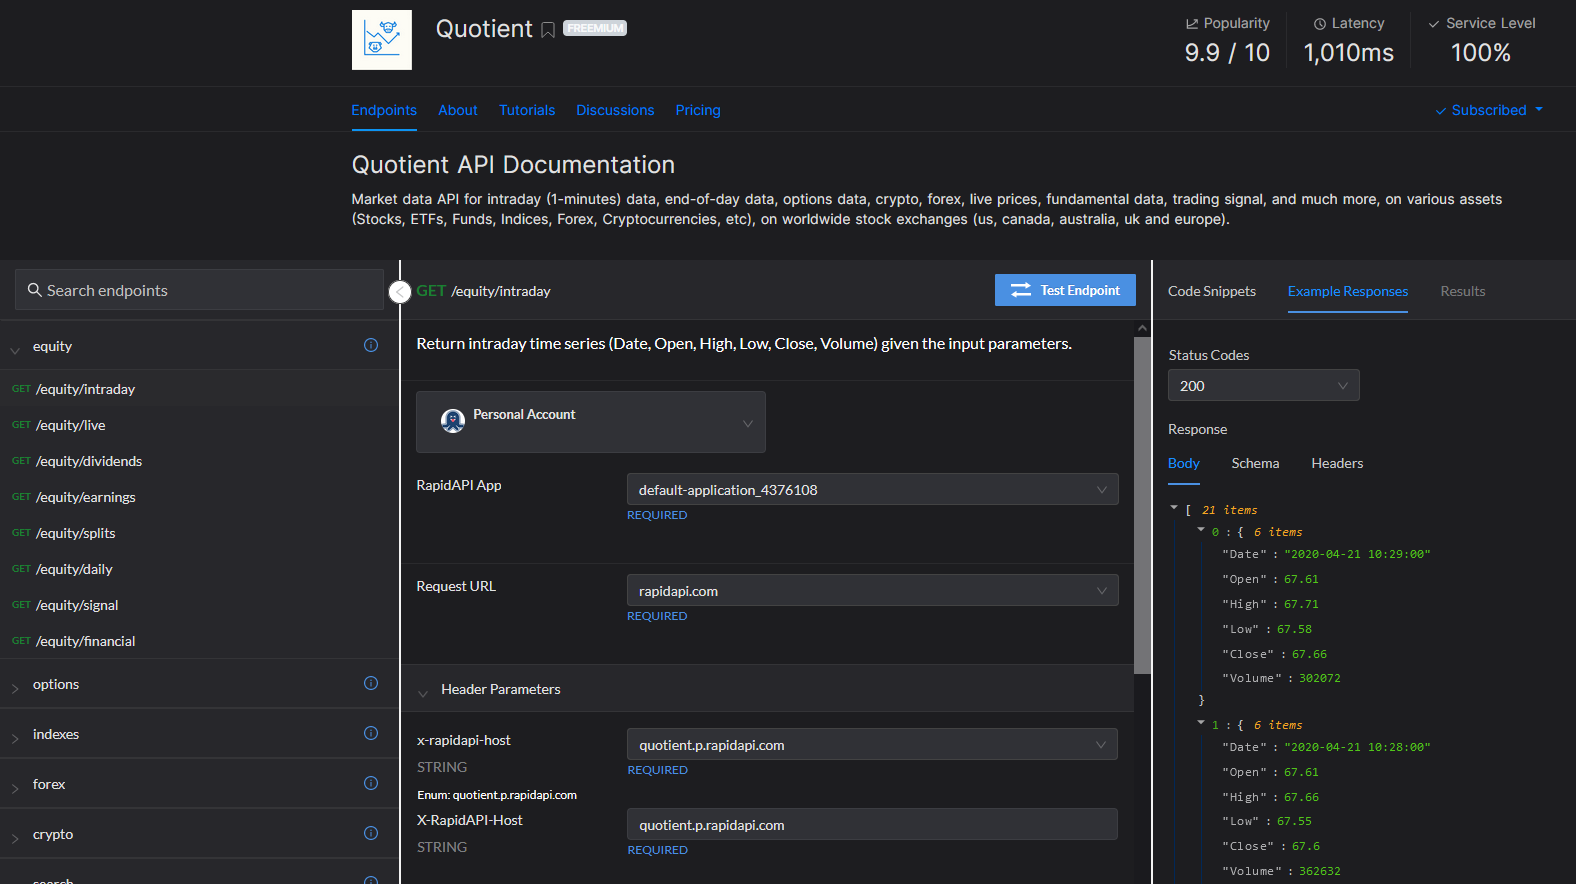
Indeed, I came across an API called Quotient which loudly proclaims to whoever wants to hear it, that it can provide: historical intraday (1-min) data, historical end of day data, live market prices, options data, trading signal, financial data and much more on various assets (Stocks, ETFs, Funds, Indices, Forex, Cryptocurrencies, etc) on worldwide stock exchanges (us, canada, australia, uk and europe). And as if that were not enough, it also provides data on earnings, dividends, splits and many other information.
The most in this pleasant discovery is that the API is hosted on the rapidapi. We can therefore directly test the endpoints of this API through the graphical interface (as you can see below) to make our own opinion on Quotient API.
I admit that I quickly fell in love with this API. So I signed up for a full access plan and got my key to call the API from code (which I will show you right away) or from Excel to do my core business: analyzing, finding and optimizing strategies for the markets.
Below, I’m going to show you how, once subscribed to Quotient API and obtained your key, use it with Python to pull intraday data and plot it.
For illustration purpose, i will choose as input data:
- symbol : QCOM
- from: 2019–07–02 09:30
- to: 2019–07–02 16:01
- intervals(min) : 1, …, 5, 15, 30, … (you can set at 1-min level)
We will first import the necessary packages and set our preferred plotting style :
1import requests
2import pandas as pd
3import matplotlib.pyplot as plt
4import matplotlib.dates as mdates
5%matplotlib inline
6
7plt.style.use('seaborn')
Then we will initialize our data as defined above and enter the API key (Remember to replace with your own API key for Quotient)
1symbol = "QCOM"
2start_date = "2019-07-02 09:30"
3end_date = "2019-07-02 16:01"
4api_key = "YOUR-API-KEY-GOES-HERE"
Once our input data initialized, then we will going to define a small function which we will call get_intraday_data which will pull the data for us from Quotient API.
1def get_intraday_data(symbol, start_date, end_date, interval):
2    url = "https://quotient.p.rapidapi.com/equity/intraday"    querystring = {
3                   "symbol": symbol,
4                   "from": start_date,
5                   "to": end_date,
6                   "interval": interval,
7                   "adjust": "false"
8                  }    headers = {
9        'x-rapidapi-host': "quotient.p.rapidapi.com",
10        'x-rapidapi-key': api_key
11        }
12
13
14    response = requests.request("GET", url, headers=headers,     params=querystring)
15
16    df=pd.DataFrame(response.json())
17    df = df.set_index(pd.DatetimeIndex(df['Date']))
18    del df['Date']
19    df = df.sort_index()
20    df['Volume'] = df['Volume'].str.replace(',', '').astype(float)
21    df = df[['Open', 'High', 'Low', 'Close', 'Volume']].apply(pd.to_numeric)
22
23    return df
We will use this function which we will call for the three types of interval chosen previously (5, 15, 30 min) and save in three different dataframes df5, df15 and df30.
1df5 = get_intraday_data(symbol, start_date, end_date, interval=5)
2df15 = get_intraday_data(symbol, start_date, end_date, interval=15)
3df30 = get_intraday_data(symbol, start_date, end_date, interval=30)
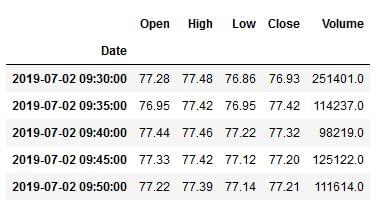
We can inspect the data obtained from the API, as follows:
1df5.head()
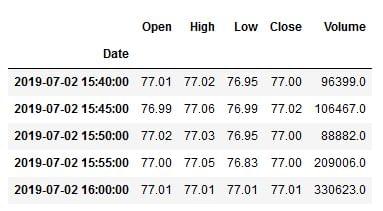
1df5.tail()
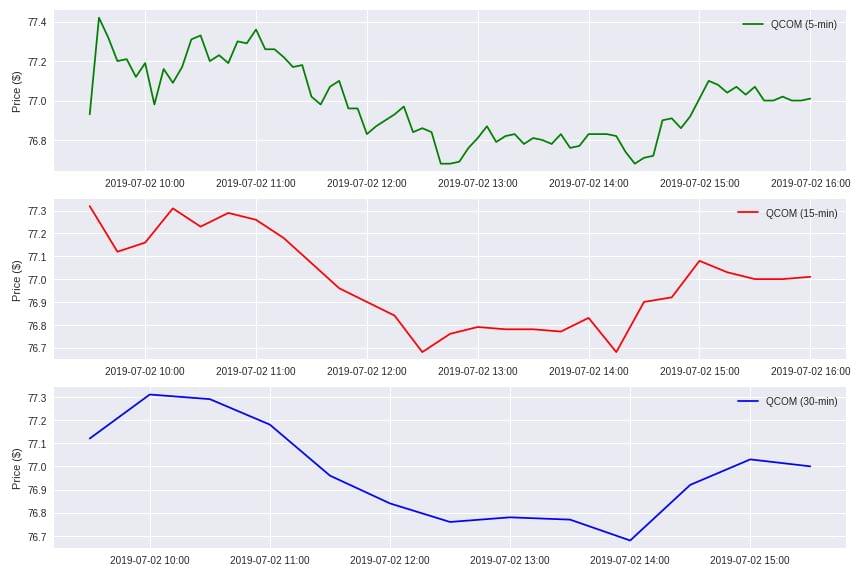
Now that we have the data, we just have to plot the closing price for these three different dataframes df5, df15 and df30.
1fig, ax = plt.subplots(nrows=3, ncols=1, figsize=(12,8))
2ax[0].plot(df5.index, df5['Close'], color='green', label='%s (5-min)' % (symbol))
3ax[1].plot(df15.index, df15['Close'], color='red', label='%s (15-min)' % (symbol))
4ax[2].plot(df30.index, df30['Close'], color='blue', label='%s (30-min)' % (symbol))ax[0].xaxis.set_major_formatter(mdates.DateFormatter('%Y-%m-%d %H:%M'))
5ax[1].xaxis.set_major_formatter(mdates.DateFormatter('%Y-%m-%d %H:%M'))
6ax[2].xaxis.set_major_formatter(mdates.DateFormatter('%Y-%m-%d %H:%M'))ax[0].grid(True)
7ax[1].grid(True)
8ax[2].grid(True)ax[0].set_ylabel('Price ($)')
9ax[1].set_ylabel('Price ($)')
10ax[2].set_ylabel('Price ($)')ax[0].legend()
11ax[1].legend()
12ax[2].legend()plt.tight_layout()
13plt.show()
Hopefully, this little post will help some who are looking for an API to get historical intraday data.